Blog

Clustering and the Ignorance of Crowds

Over on the Cheap Talk blog (@CheapTalkBlog), Jeff Ely (@jeffely) has an interesting post about the "Ignorance of Crowds." The basic idea is that when there are lots of connections among people, each individual has less incentive to seek out costly information — e.g. subscribe to the newspaper — on their own, because instead they can just get that information ("free ride") from others. More connections means more free riding and fewer informed individuals.

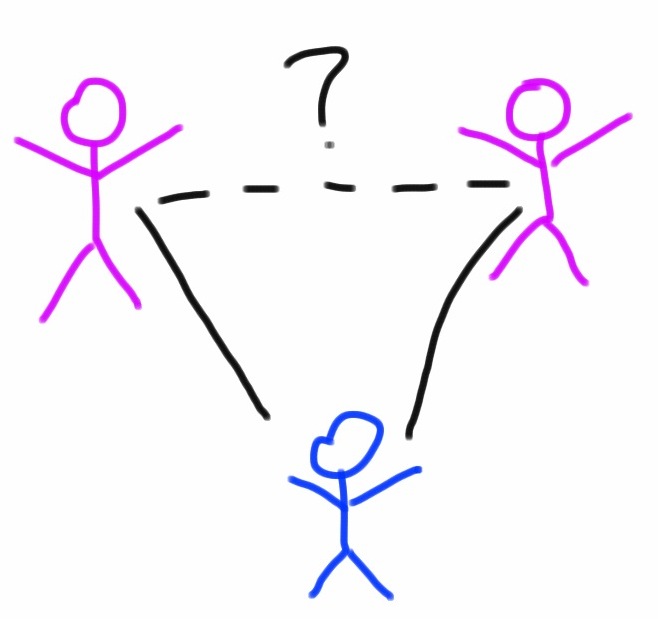
I take a much more complicated route to the same conclusion in "Network Games with Local Correlation and Clustering." Besides being sufficiently mathematically intractable to, hopefully, be published, the paper does show a few other things too. In particular, I look at how network clustering affects "public goods provision," which is the fancy term for what Jeff Ely calls subscribing to the newspaper. Lots of real social networks are highly clustered. This means that if I'm friends with Jack and Jill, there is a good chance that Jack and Jill are friends with each other. What I find in the paper is that clustering increases public goods provision. In other words, when people are members of tight knit communities, more people should subscribe to the newspaper (and volunteer, and pick up trash, and ...)

It's pretty clear that the Internet, social media etc... are increasing the number of contacts that we have, but an interesting question that I haven't seen any research on is How are these technologies affecting clustering (if at all)?

"Predicting the Present" at the CIA

The CIA is using tools similar to those we teach in the Kellogg Social Dynamics and Networks course to "predict the present" according to an AP article (see also this NPR On the Media interview).

While accurately predicting the future is often impossible, it can be pretty challenging just to know what's happening right now.  Predicting the present is the idea of using new tools to get a faster, better picture of what's happening in the present.  For example, the US Bureau of Labor and Statistics essentially gathers the pricing information that goes into the Consumer Price Index (CPI) by hand (no joke, read how they do it here). This means that the governments measure of CPI (and thus inflation) is always a month behind, which is not good for making policy in a world where decades old investment banks can collapse in a few days.

To speed the process up, researchers at MIT developed the Billion Prices Project, which as the name implies collects massive quantities of price data from across the Internet to get a more rapid estimate of CPI. The measure works, and is much more responsive than the governments measure. For example, in the wake of the Lehman collapse, the BPP detected deflationary movement almost immediately while it took more than a month for those changes to show up in the governments numbers.

A Gephi Visualization of Gephi on Twitter

This is a visualization of Twitter accounts that follow and are followed by @gephi that I made using ... Gephi. I collected the data using NodeXL. Two accounts are linked in the network if one follows the other on Twitter. Nodes are sized according to their degree. The modularity clustering algorithm finds 8 different groups among the accounts.  The blue group in the upper left, where I live, contains most of the network science crowd: @duncanjwatts, @ladadimc, @barabasi, @davidlazer, etc... The green group in the lower right seem to be data/visualization folks. I filtered out all of the nodes with degree less than four, before which there is a large contingent of accounts that followed @gephi, but with no other connections in the network.

Why Google Ripples will be a lot less cool than it sounds.

Google + now has a new feature, Ripples, that allows you to see a network visualization of the diffusion of a post (see the Gizmodo article here).  The pictures are cool, but the original post has to be public, and then it has to be shared by one Google+ user to other Google+ users.  But, the chance of interesting ripples happening very often are pretty slim; here's why.

Bakshy, Hofman, Mason, and Watts looked at exactly this kind of cascade on Twitter, which is a great platform for this kind of research for several reasons.  First, everything is effectively public, so there are none of the privacy issues of Facebook, and we don't have to limit ourselves to looking at just the messages that people choose to make public like we do on Google +.  Second, "retweeting" messages is an established part of Twitter culture, so we expect to find cascades. Finally, since tweets are limited to 140 characters, links are often shortened using services like bit.ly.  This means that if I create a link to a New York Times article and you create a link to the same page independently, those links will be different, so the researchers can tell the difference between a cascade that my post creates and one that yours creates.

Some of the cascades that Bakshy et al. found are shown in this figure.

They looked at 74 million chains like these initiated by more than 1.6 million Twitter users during two months in 2009.  A lot of interesting things came out of the study, but the most important one for Google Ripples is that 98 percent of the URLs were never reposted.  That's not good for Ripples.  The latest number puts the entire Google plus user population at only 43.6 million users, and since only a small fraction of these users' posts will be public posts, even if people share other people's posts on Google+ as frequently as the retweet links on Twitter (which is unlikely), we still can't expect to see many Ripples that look like anything but a lonely circle.

Visualizing Your Facebook Network with Gephi

This is a visualization of my own Facebook network that I made using the (free) software Gephi and the Facebook application netvizz.  Each node in the network is one of my Facebook friends, and two friends are connected to one another if they are Facebook friends with each other.  The size of the node corresponds to the "degree" of the node, which means how many connections it has.  In this case, that means how many of my Facebook friends that person is Facebook friends with.  (Note: I deleted the names from the nodes to protect my Facebook friends' privacy).

The colors of the nodes indicate communities of friends found using a clustering algorithm based on the "modularity" of the network.  Basically what the algorithm does is try to group the nodes into communities with lots of connections within each community and not too many connection between the communities.  Even though the algorithm doesn't know anything about my friends, other than the web of connections (it doesn't even know they're people), it does a good job of picking identifying groups of my friends that belong to the same communities in real life.  For example the purple cluster in the upper right are people I know from graduate school, the little green cluster in the lower right are people from the Northwestern Institute on Complex Systems.  The big bunch in the middle are people I know from high school, with the people from the band (or band groupies) in green on the right side.  My wife is the purple node that bridges the gap between my graduate school friends and my huh school friends.

We did this as an exercise in the Social Dynamics and Networks course that I teach at Kellogg.  If you want to see how you can map your network, you can find instructions on my Kellogg website here.

Detecting Illicit Activity by Examining Communication Network Structure

This article from The Atlantic's website describes some fascinating research by Brandy Aven at CMU's Tepper School that demonstrates how communication networks discussing illicit activity differ from those discussing routine matters by examining the Enron email archives. It's a great example of how the structure of a network can reveal information about the process that generated it.

Northwestern's Defeat to the Illini as Seen on Twitter

The title says it all.  Here's the link.

Marketing and Social Media

If you are looking for tips on social media and marketing I suggest checking out the Facebook page of Hunter & Bard.

Hunter & Bard is headed up by Shira Abel, who I was fortunate to meet when she took my class in the Kellogg-Recanati International EMBA program in Tel Aviv. ( As of today Shira has exactly 518.1111... times more followers on Twitter than I do.)  The page is packed with social media and marketing information. (In fact, I have Shira to thank for sharing the Twitter Terrorists story with me.)

Twitter Terrorists: False information + positive feedbacks = real panic

Another example of how false information, amplified through positive feedbacks, can lead to real panic: in Veracruz Mexico two people posted messages on twitter reporting kidnappings at a local school. The messages spread rapidly through social media leading frightened parents to rush to try and save their children. The panic caused dozens of car accidents and jammed the city's emergency phone lines.

Amnesty International was quoted saying, "The lack of safety creates an atmosphere of mistrust in which rumours that circulate on social networks are part of people's efforts to protect themselves, since there is very little trustworthy information." As with many "tipping point" phenomenon, before the spark that set off the visible cascade, there was most likely a "contextual tipping point" that made the resulting contagion possible. Governments or managers have to realize that the only way to reliably prevent these cascades is by changing the context, not by stamping out all of the sparks.

The S&P credit downgrade, turmoil in the markets, and the 1973 toilet paper shortage

On Friday, August 5, Standard & Poor's downgraded the credit rating of the U.S. long-term debt to AA+.  On Monday, the first day the markets opened since the downgrade, the Dow Jones Industrial average dropped 5.6 percent and the S&P 500 fell 6.7 percent — the biggest single day drops since the crisis in 2008.  A lot of people might be confused about this turmoil in the markets, since US debt is still considered one of the safest investments there is.  Jay Forrester, founder of the field of System Dynamics, calls puzzles like this the "counterintuitive behavior of social systems."

Undoubtedly, the world economy is incredibly complex, and no individual or organization has a complete picture of how it works or where it's headed.  Through pricing, the market is supposed to aggregate all of the pieces of partial information that we each hold and then converge to the "truth" — that is prices should reflect true underlying value.  In some situations this can actually work.  Prediction markets have been shown to be valuable tools for businesses to harvest the "wisdom of the crowds" and assess the probabilities that future events occur.  But, this mechanism works best when individuals place their trades independently based on their own private information. In the real world, market dynamics are fundamentally social dynamics and as such they are subject to cascades of panic and the accumulation of overconfidence (what Alan Greenspan famously referred to as "irrational exuberance" (see also Robert Shiller)).


The current panic illustrates how even when there is no fundamental basis for a panic, social dynamics can amplify the signal of a panic to the point where an actual crisis ensues.  The gas shortages of 1979 are a classic example of this phenomenon.  The Iranian revolution sharply cut oil imports to the US from Iran.  Nervous consumers rushed to top off their tanks and even to hoard gasoline at home.  This drained the supply of gasoline at filling stations leading to an actual gasoline shortage.  Word-of-mouth and media coverage reinforced consumer fears of shortages, leading to even more topping off and hoarding, as well as government policies such as odd/even day purchase rules that actually further incentivized consumers to top off frequently and store gasoline at home.  Surprisingly, despite the very real shortage of gasoline at filling stations, US oil imports for the year actually increased in 1979 compared 1978.  The crisis was caused by social dynamics, not an actual drop in supply. (See Sterman, Business Dynamics p. 212).

A similar but more comical crisis occurred in 1973 when Johnny Carson made a joke saying, "You know what’s disappearing from the supermarket shelves?  Toilet paper.  There’s an acute shortage of toilet paper in the United States."  Consumers rushed out to stock up on toilet paper, leading to a real toilet paper shortage in the US that lasted several days.  Even though Carson tried to correct the joke a few days later, by that time toilet paper was in fact in short supply because people were hoarding it at home.