Tipping Points

Of Monsters and Men — How an Icelandic Band Exploded using the Web

Bo Olafsson, a Kellogg student that took Social Dynamics and Networks with me this past fall quarter, put together a nice slideshow explaining how a little known Icelandic band, Of Monsters and Men, became a huge US success without ever visiting the country. Check it out:

Interestingly, Bo's slides have become a mini viral phenomenon themselves garnering press attention in both Iceland and the US:

What it takes to "Go Viral"

It seems like we hear a new story every week: a video, or a rumor, or a song, or a commercial has "gone viral," spreading across the web like wildfire, racing to the top of the most tweeted list, and grabbing headlines in real old fashioned news media. These memes can be disgusting (like the Domino's pizza video), controversial (like the recent Kony 2012 video), and entertaining ("Friday" ?). They can be disasters for companies (see Domino's above), or marketing campaigns that reach hundreds of thousand, or even millions, of viewers for relatively little investment (1300 foot drop, the Old Spice Guy). Given the potential impact of these "memes," there is a lot of interest in what exactly determines whether or not a video, or a message, or a rumor goes viral. Here's a simple model that explains why some things do and some things don't.

Let's consider the example of a YouTube video. Suppose that on average, every person that views the video tells of their friends about it per day (stands for contacts), and suppose that some fraction of the people that hear about the video actually watch it and start telling other people about it themselves (i stands for infectivity, and captures something like how interesting the video is.) Finally, suppose that on average, each person that is actively spreading word of the video does so for d days before they get bored and stop telling people about the video (d stands for duration).

To keep things simple, suppose that there are a total of N people in the population, and every one of these people is either actively spreading the video, or not actively spreading the video, but susceptible to becoming a video spreader. Let I denote the number of people currently spreading (i.e. infected) and S the number of people that are susceptible, but not currently spreading the video. So, I+S=N.

To see if the video goes viral or not, we just have to compare the rate at which people are becoming infected to the rate at which people are discontinuing sharing the video. It helps to think of a bath tub — the level of water in the bath tub represents the number of people spreading the video. The rate that water flows in through the faucet is the rate at which new people are becoming infected with the video spreading virus; the rate at which water drains out is the rate at which people are stopping spreading the video. If the rate at which water flows in is higher than the rate at which it drains out, the tub will keep filling up. On the other hand, if the drain is more open than the faucet, the bath tub will never fill up.

So, we have to figure out the rate at which new people are starting to spread the video and the rate at which people currently sharing the video are stopping. The second one is easier. If I people are currently sharing the video and each one of them shares it for d days on average, then each day we expect I/D people to stop spreading the video. For the first rate, we have I people actively sharing the video. On average, each one of them shares the video with c contacts per day, resulting in a total of cI contacts for the whole population. But, not all of these contacts results in a new person sharing the video. First, some of these people will already be sharing the video. The probability that a given person is not currently sharing the video is S/N, the fraction of "susceptible" people in the population. So, we expect cIS/N instances in which a person shares the video with someone that is currently spreading the video. Given such a contact, we said that a fraction i of these will result in a new person sharing the video. Putting it all together, the rate at which new people are becoming infected with the video sharing virus is ciIS/N.

Now we have to compare our two rates. The video will go viral if ciIS/N>I/d. Dividing both sides by I and multiplying both sides by d, this becomes, cidS/N>1. Finally, we can make life a little simpler by assuming that initially almost no one knows about the video, so the number of susceptible people S and the total population N are about the same. Then S/N is approximately 1, so the equation simplifies to just cid>1.

This simple equation tells us whether or not the video will go viral. It says if the average number of contacts, times the infectivity, times the duration is greater than one, the video will spread, otherwise it will die out. Right at cid=1 there is a tipping point; crossing this threshold causes a discontinuous jump in the future.

This model makes a lot of assumptions that don't really hold (big ones are that people have roughly the same # of contacts on average, and the people basically interact at random), but it gives us a basic understanding of the process. Even in more complicated models, where we make fewer simplifying assumptions, there is typically a similar tipping point, and increasing either contacts, infectivity, or duration increases the chance of crossing that threshold.

So, there you have it — everything you need to go viral: a network with enough contacts (c); a product, or message, that sounds interesting enough to be infectious (i), and with enough staying power so that people keep telling their friends about it for a long time (d).

Social Dynamics Videos

While I've been teaching Social Dynamics and Networks at Kellogg, I've amassed a collection of links to interesting videos on social dynamics. Here they are:

Duncan Watts TEDx talk on "The Myth of Common Sense"

Nicholas Christakis TED talk on "The hidden influence of social networks"; TED talk on "How social networks predict epidemics."

James Fowler talking about social influence on the Colbert Report.

Sinan Aral TEDx talk on "Social contagion"; at PopTech 2010 on "Social contagion"; at Nextwork on "Social contagion"; at the International Conference on Weblogs and Social Media on "Content and causality in social networks."

Scott E. Page on "Leveraging Diversity", and at TEDxUofM on "Putting Milk Crates on the Internet."

Eli Pariser TED talk on "Beware online 'filter bubbles'"

Freakonomics podcast on "The Folly of Prediction"

Damon Centola on "Network Contagion."

Jure Leskovec on "The Web as a Laboratory for Studying Humanity"

There are several good videos of talks from the Web Science Meets Network Science conference at Northwestern: Duncan Watts, Albert-Laszlo Barabasi, Jure Leskovec, and Sinan Aral.

The "Did You Know?" series of videos has some incredible information about, well, information. More info here.

Twitter Terrorists: False information + positive feedbacks = real panic

Another example of how false information, amplified through positive feedbacks, can lead to real panic: in Veracruz Mexico two people posted messages on twitter reporting kidnappings at a local school. The messages spread rapidly through social media leading frightened parents to rush to try and save their children. The panic caused dozens of car accidents and jammed the city's emergency phone lines.

Amnesty International was quoted saying, "The lack of safety creates an atmosphere of mistrust in which rumours that circulate on social networks are part of people's efforts to protect themselves, since there is very little trustworthy information." As with many "tipping point" phenomenon, before the spark that set off the visible cascade, there was most likely a "contextual tipping point" that made the resulting contagion possible. Governments or managers have to realize that the only way to reliably prevent these cascades is by changing the context, not by stamping out all of the sparks.

The S&P credit downgrade, turmoil in the markets, and the 1973 toilet paper shortage

On Friday, August 5, Standard & Poor's downgraded the credit rating of the U.S. long-term debt to AA+.  On Monday, the first day the markets opened since the downgrade, the Dow Jones Industrial average dropped 5.6 percent and the S&P 500 fell 6.7 percent — the biggest single day drops since the crisis in 2008.  A lot of people might be confused about this turmoil in the markets, since US debt is still considered one of the safest investments there is.  Jay Forrester, founder of the field of System Dynamics, calls puzzles like this the "counterintuitive behavior of social systems."

Undoubtedly, the world economy is incredibly complex, and no individual or organization has a complete picture of how it works or where it's headed.  Through pricing, the market is supposed to aggregate all of the pieces of partial information that we each hold and then converge to the "truth" — that is prices should reflect true underlying value.  In some situations this can actually work.  Prediction markets have been shown to be valuable tools for businesses to harvest the "wisdom of the crowds" and assess the probabilities that future events occur.  But, this mechanism works best when individuals place their trades independently based on their own private information. In the real world, market dynamics are fundamentally social dynamics and as such they are subject to cascades of panic and the accumulation of overconfidence (what Alan Greenspan famously referred to as "irrational exuberance" (see also Robert Shiller)).


The current panic illustrates how even when there is no fundamental basis for a panic, social dynamics can amplify the signal of a panic to the point where an actual crisis ensues.  The gas shortages of 1979 are a classic example of this phenomenon.  The Iranian revolution sharply cut oil imports to the US from Iran.  Nervous consumers rushed to top off their tanks and even to hoard gasoline at home.  This drained the supply of gasoline at filling stations leading to an actual gasoline shortage.  Word-of-mouth and media coverage reinforced consumer fears of shortages, leading to even more topping off and hoarding, as well as government policies such as odd/even day purchase rules that actually further incentivized consumers to top off frequently and store gasoline at home.  Surprisingly, despite the very real shortage of gasoline at filling stations, US oil imports for the year actually increased in 1979 compared 1978.  The crisis was caused by social dynamics, not an actual drop in supply. (See Sterman, Business Dynamics p. 212).

A similar but more comical crisis occurred in 1973 when Johnny Carson made a joke saying, "You know what’s disappearing from the supermarket shelves?  Toilet paper.  There’s an acute shortage of toilet paper in the United States."  Consumers rushed out to stock up on toilet paper, leading to a real toilet paper shortage in the US that lasted several days.  Even though Carson tried to correct the joke a few days later, by that time toilet paper was in fact in short supply because people were hoarding it at home.

Another Tipping Point Sighting

The New York Times makes another tipping point claim today.  This one seems more believable:  “For many gay rights advocates, the decision amounts to a turning point in the debate — the moment at which opposition to same-sex marriage came to look like bigotry, similar to racial discrimination and the subordination of women.”  Attitudes regarding gay marriage (and segregation, women’s rights, ...) are social norms, and norm formation is a process that social scientists have studied and modeled extensively.  Almost all of these models do exhibit tipping behavior.  Whether or not this is in fact the tipping point for norms regarding the definition of marriage is an empirical question, but such a tipping point almost certainly exists.

Economists Seek Tipping Point

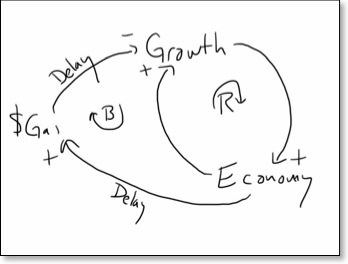
This article in the New York Times describing a “tipping point” in the effect of gas prices on the economy is a good example of bad use of the term tipping point.  Unfortunately, the term has become so popularized that it has lost a lot of its meaning (Scott Page and I try to resurrect it in a recent paper that’s currently under review).  The gist of the article is a simple model that goes like this:

  • When the economy gets better, gas prices rise.
  • When gas prices rise, growth slows down.
  • Economic growth is a self-reinforcing process — the bigger the economy, the faster it grows.


From a system dynamics perspective there are two feedback loops in this model: the reinforcing loop of economic growth and the balancing loop that goes through gas prices.  Since the links between the economy and gas prices and gas prices and growth both have delays in them, this structure leads to oscillation in both gas prices and the economy.  The economy grows, leading to more growth.  Eventually gas prices catch up and start to slow economic growth until it begins to decline.  At this point, growth is negative leading the economy to shrink, leading to more negative growth as the reinforcing feedback works in the opposite direction.  Eventually gas prices fall low enough to start the recovery, and the oscillation repeats.  The article suggests that we may be reaching the top of one of the peaks in the economy, at which the rise in gas prices causes growth to go from positive to negative.  But this is not a tipping point.  At a tipping point, a small change causes a big change.  In this case, if we believe this model and that we’re at the crest of one of these cycles, a small increase in gas prices causes a small decrease in the growth rate.  It just happens to go from very slightly positive to very slightly negative, but this is still a small change — not a tip.